
Analytics
Track usage, monitor quotas, and understand your image generation patterns.
Overview
Go Bananas! provides comprehensive analytics for:
- Usage tracking: Images generated, edits made
- Quota monitoring: Storage limits, rate limits
- Cost estimation: Based on generation volume
- Pattern analysis: Peak usage times, popular features
Account Summary
Get a complete overview of your account:
Show me my account summaryReturns:
{
  "account": {
    "tenant_name": "Creative Studio",
    "created_at": "2024-01-15"
  },
  "library": {
    "characters": 12,
    "style_presets": 5,
    "product_references": 8,
    "most_used_character": "Luna",
    "most_used_preset": "Cinematic"
  },
  "images": {
    "total": 1523,
    "generations": 1200,
    "edits": 323,
    "storage_mb": 856.4,
    "avg_size_kb": 562
  },
  "sessions": {
    "total": 245,
    "active": 3,
    "avg_images_per_session": 6.2
  },
  "recent_activity": {
    "last_30_days_images": 342,
    "api_calls_this_month": 1847,
    "daily_average": 11.4
  }
}Usage Statistics
Basic Usage Query
Show me my usage statisticsFiltered Query
Show me my usage for the last 30 days, grouped by dayParameters
| Parameter | Options | Default |
|---|---|---|
lookback_days | 1-90 | 7 |
granularity | hour, day, week | day |
operation | generate_image, edit_image, etc. | all |
Response
{
  "summary": {
    "total_operations": 1847,
    "total_images": 1523,
    "total_size_mb": 856.4,
    "avg_duration_ms": 3450
  },
  "buckets": [
    {
      "period": "2024-01-15",
      "operations": 45,
      "images": 38,
      "size_mb": 21.3,
      "avg_duration_ms": 3200
    },
    {
      "period": "2024-01-14",
      "operations": 52,
      "images": 44,
      "size_mb": 24.8,
      "avg_duration_ms": 3500
    }
  ]
}Quota Management
Storage Quota
Each tenant has a monthly storage quota:
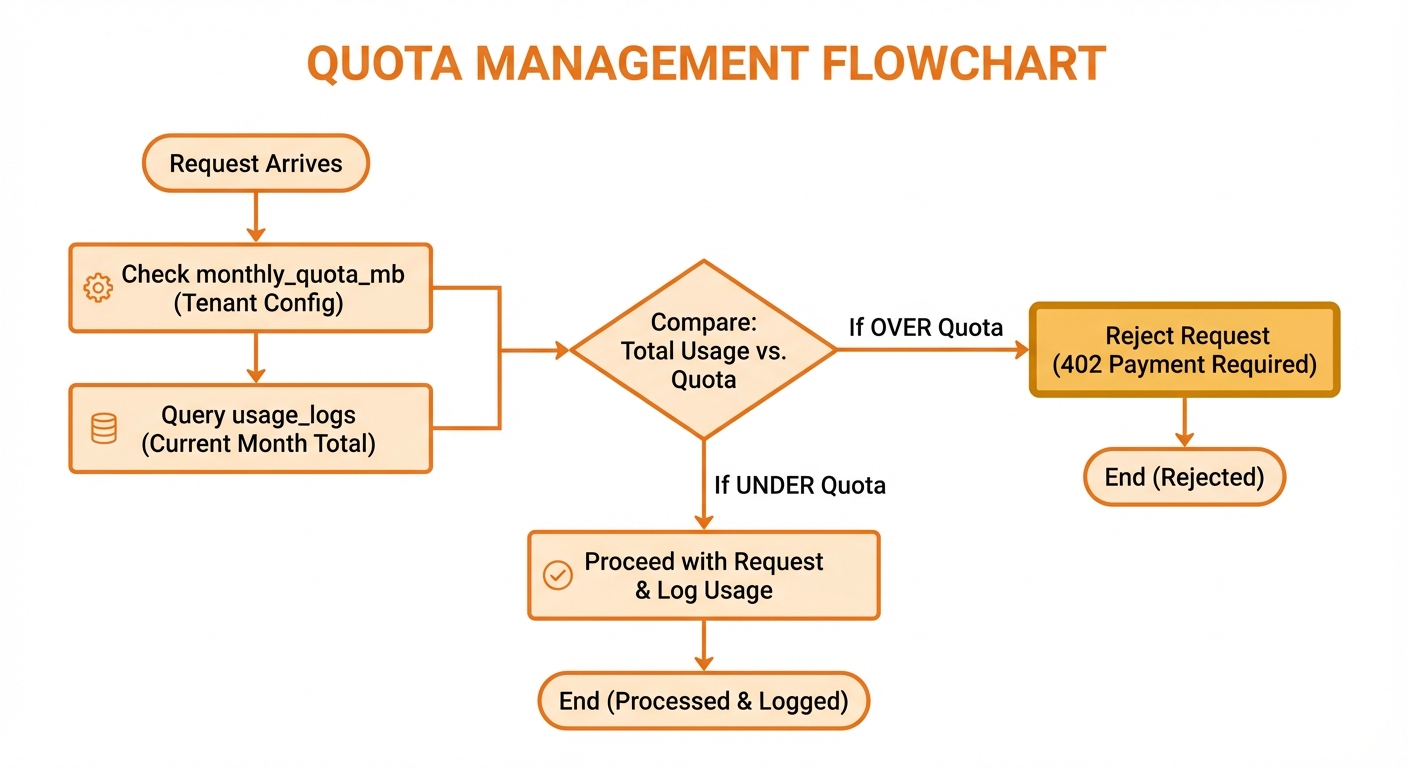
Quota thresholds: Normal, Warning, Critical, Blocked
Check your quota:
What's my storage quota status?Response:
{
  "quota": {
    "monthly_mb": 1024,
    "used_mb": 856.4,
    "remaining_mb": 167.6,
    "usage_percent": 83.6,
    "status": "warning"
  }
}Rate Limits
| Limit | Default | Customizable |
|---|---|---|
| Requests/minute | 60 | Yes |
| Concurrent requests | 10 | Yes |
| Images/request | 4 | No |
When rate limited:
{
  "error": "Rate limit exceeded",
  "retry_after": 30,
  "limit": 60,
  "used": 60,
  "window": "1 minute"
}Analytics Dashboard
The web console provides visual analytics:
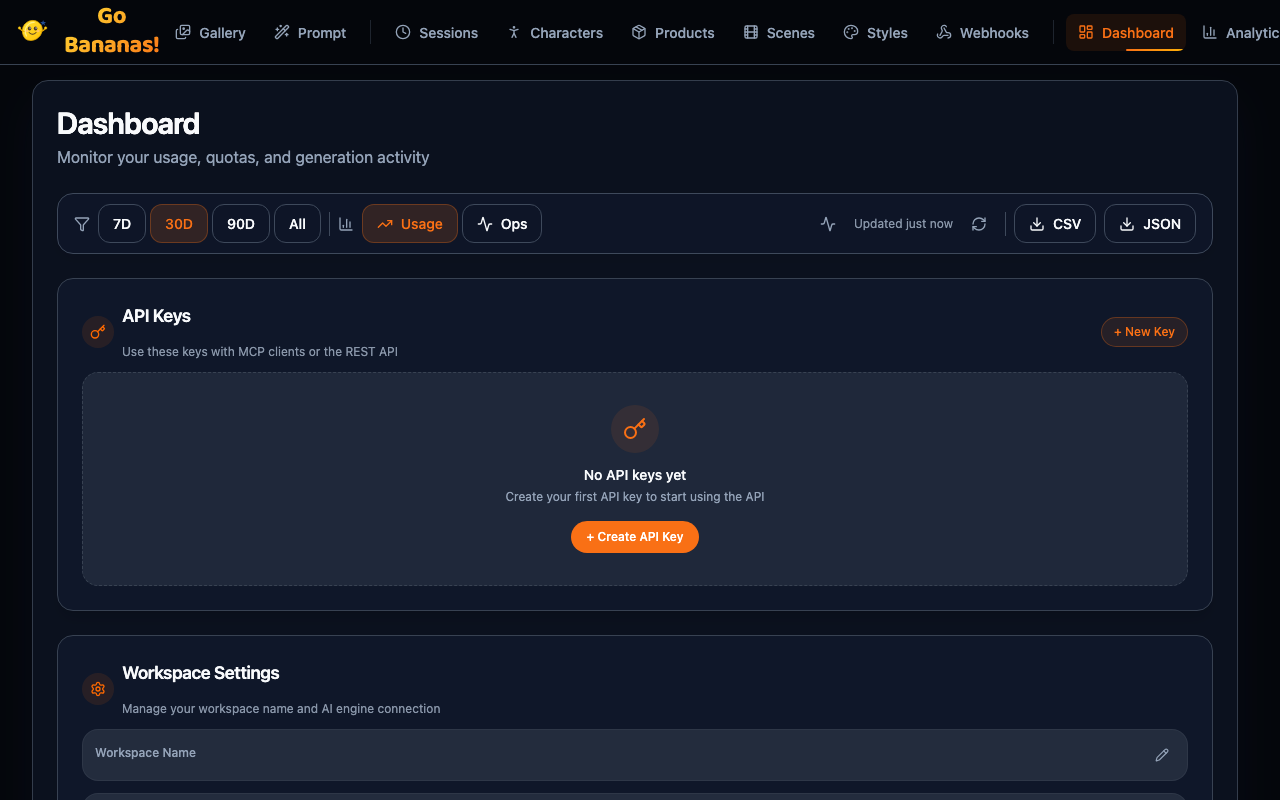
Available Charts
- Usage Over Time: Line/area chart of daily generation volume
- Operations Breakdown: Pie chart of operation types
- Storage Trend: Storage accumulation over time
- Session Activity: Active sessions per day
Key Metrics
| Metric | Description |
|---|---|
| Total Images | Cumulative images generated |
| Monthly Images | This month's generation count |
| Storage Used | Current storage consumption |
| Avg Generation Time | Mean time per image |
| Active Sessions | Currently active sessions |
| Character Usage | Most used characters |
Usage Patterns
Identifying Trends
Show me my usage trend for the last 30 daysLook for:
- Peak days: When do you generate most?
- Growth rate: Is usage increasing?
- Efficiency: Edit-to-generate ratio
Optimizing Usage
Reduce storage:
- Delete unused images
- Use appropriate image sizes
- Archive old sessions
Optimize rate limits:
- Batch requests during off-peak
- Use multi-image generation (1-4)
- Cache character and product references
Cost Estimation
While exact pricing varies, typical provider output costs are:
| Model | Approximate Cost |
|---|---|
| Gemini Flash Image | ~$0.067/image at 1K, ~$0.101/image at 2K, ~$0.151/image at 4K |
| Gemini Pro Image | ~$0.134/image at 1K or 2K, ~$0.240/image at 4K |
| OpenAI GPT Image 2 | Token-priced; check_quota provides low/medium/high heuristics |
Monthly estimation:
1000 Flash 1K generations = ~$67
500 Pro 1K generations = ~$67
Total: ~$134/month before input/reference-image chargesPlus Cloudflare costs:
- Workers: $5/month (paid plan)
- R2: $0.015/GB stored
- D1: Pay-as-you-go
Exporting Data
From Web Console
The dashboard supports exporting:
- CSV: Spreadsheet-compatible
- JSON: Programmatic processing
From API
curl -H "X-API-Key: sk_live_xxx" \
"https://api.example.com/api/usage?lookback_days=30"Setting Up Alerts
While built-in alerts aren't available, you can:
1. Monitor via API
import requests

response = requests.get(
    "https://api.example.com/api/profile",
    headers={"X-API-Key": "sk_live_xxx"}
)

quota = response.json()["tenant"]["quotas"]
if quota["used_mb"] / quota["monthly_mb"] > 0.9:
send_alert("Storage quota at 90%!")2. Use Cloudflare Analytics
Cloudflare provides:
- Request volume
- Error rates
- Response times
3. Webhook Integration
For enterprise setups, implement webhooks for:
- Quota warnings
- Rate limit approaches
- Unusual activity
API Details
Get Usage Stats
{
  "tool": "get_usage_stats",
  "params": {
    "lookback_days": 30,
    "granularity": "day",
    "operation": "generate_image"
  }
}Get Account Summary
{
  "tool": "get_account_summary",
  "params": {}
}REST API
# Profile with quota
curl -H "X-API-Key: sk_live_xxx" \
  https://api.example.com/api/profile

# Usage statistics
curl -H "X-API-Key: sk_live_xxx" \
"https://api.example.com/api/usage?limit=12"Best Practices
1. Regular Monitoring
Check usage weekly to avoid surprises:
Show me my weekly usage summary2. Clean Up Regularly
Delete test images and unused content:
Search for images from last month that I haven't edited3. Track by Project
Use custom session IDs to track project costs:
Show me usage for session "project-x"4. Set Internal Limits
Before hitting quotas, set team guidelines:
- Max images per project
- Approval for Pro model usage
- Regular cleanup schedules
Troubleshooting
Quota Exceeded
Error: Storage quota exceededOptions:
- Delete unused images
- Request quota increase (contact admin)
- Wait for monthly reset
Unexpected Usage
High usage? Check:
- Automated scripts running
- Multiple team members active
- Unused test workflows
Show me usage breakdown by operation typeMissing Analytics Data
If data seems incomplete:
- Analytics aggregate with slight delay
- Check date range parameters
- Verify API key permissions