
Analytics
Analytics (in the sidebar's Insights group) shows how much your workspace has generated and stored over time.
Date range
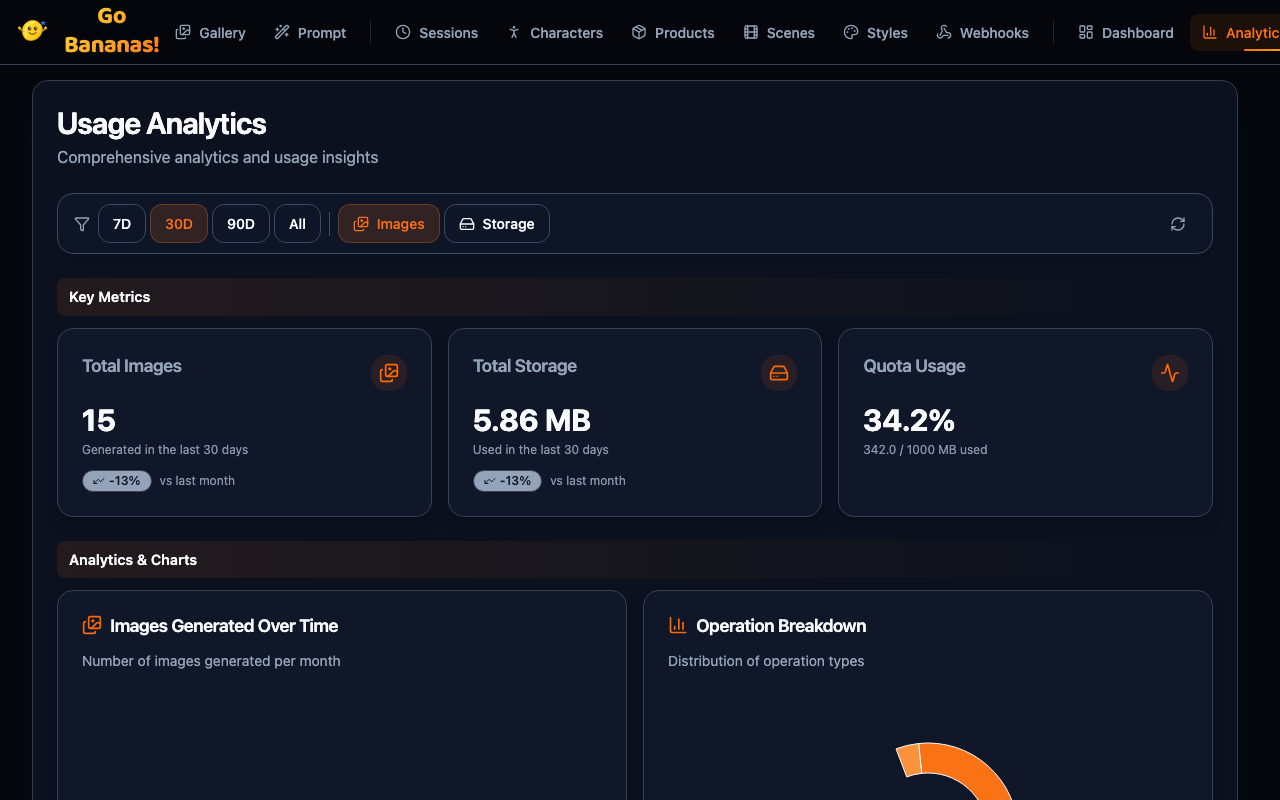
Pick a range at the top of the page: 7D, 30D, 90D or All time. The cards, charts and table all follow it. The Images and Storage buttons switch the usage chart between image counts and bytes.
Key metrics
| Card | What it shows |
|---|---|
| Total Images | Images recorded by operations in the selected range, with a calendar-month comparison |
| Storage Added | Bytes added by operations in the selected range, with a calendar-month comparison |
| Quota Usage | Storage charged this month as a percentage of the monthly quota, in MB |
Charts
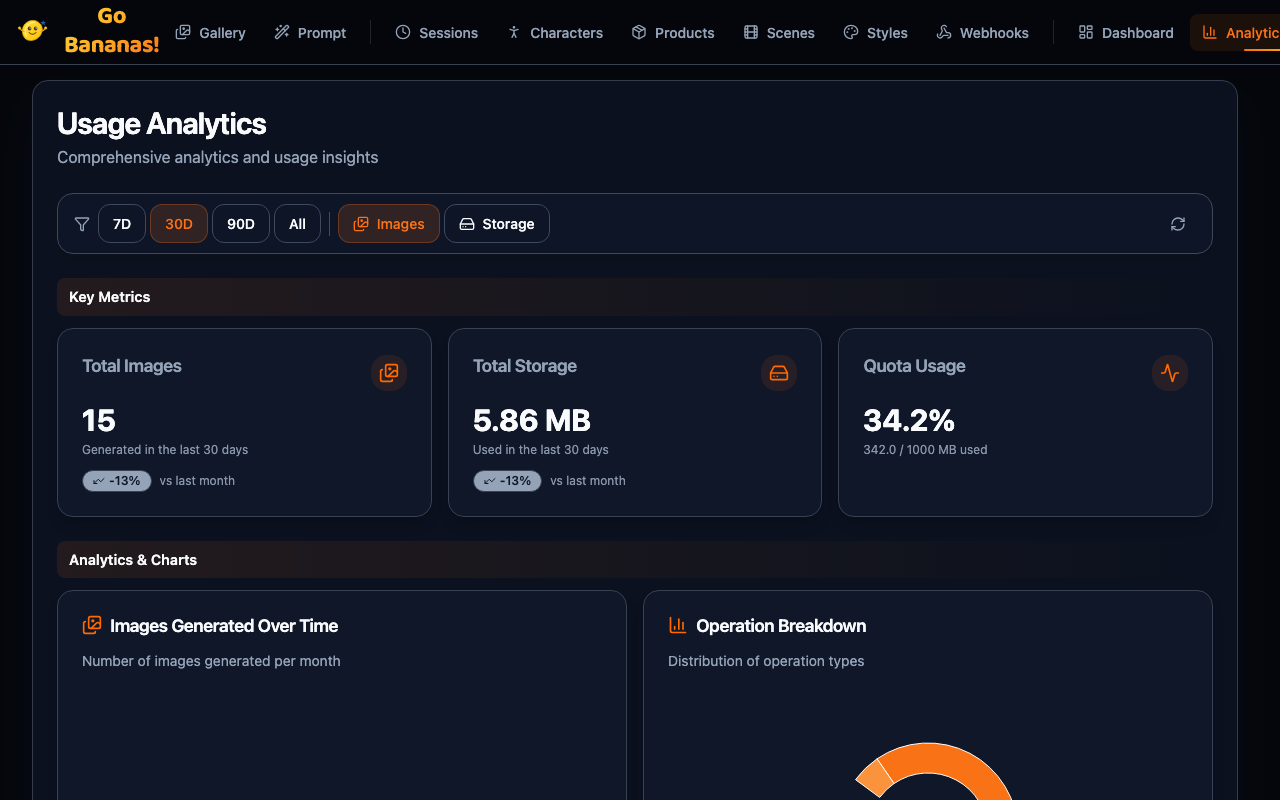
- Usage chart: images or storage over the selected range.
- Operation breakdown: how your usage splits between operation types, such as generations and edits.
Monthly breakdown
A table of monthly totals, up to 24 months, with these columns: Month, Operations, Images, Storage and Avg Duration.
Usage by model
The Analytics page does not split usage by model. Every generated image records the model that made it (one of the eight: Nano Banana 2 Lite, Nano Banana 2.1, Go Bananas! Pro, OpenAI GPT Image 2, OpenAI GPT Image 2.6 Flare, OpenAI GPT Image 2.6 Sunburst, OpenAI GPT Image 2.5 Flare and OpenAI GPT Image 2.5 Sunburst), and the image details in the Gallery show it. Older images can still show the retired Nano Banana 2.
API Access
Analytics data is also available through:
- MCP tools:
get_usage_stats,get_account_summary - REST API:
GET /api/usage
See Analytics tools for details.
Next Steps
- View your quota on Dashboard
- Manage sessions to review activity
- Admin panel for tenant management (super-admins only)