
Dashboard
The Dashboard provides an at-a-glance view of your usage, quotas, and analytics.
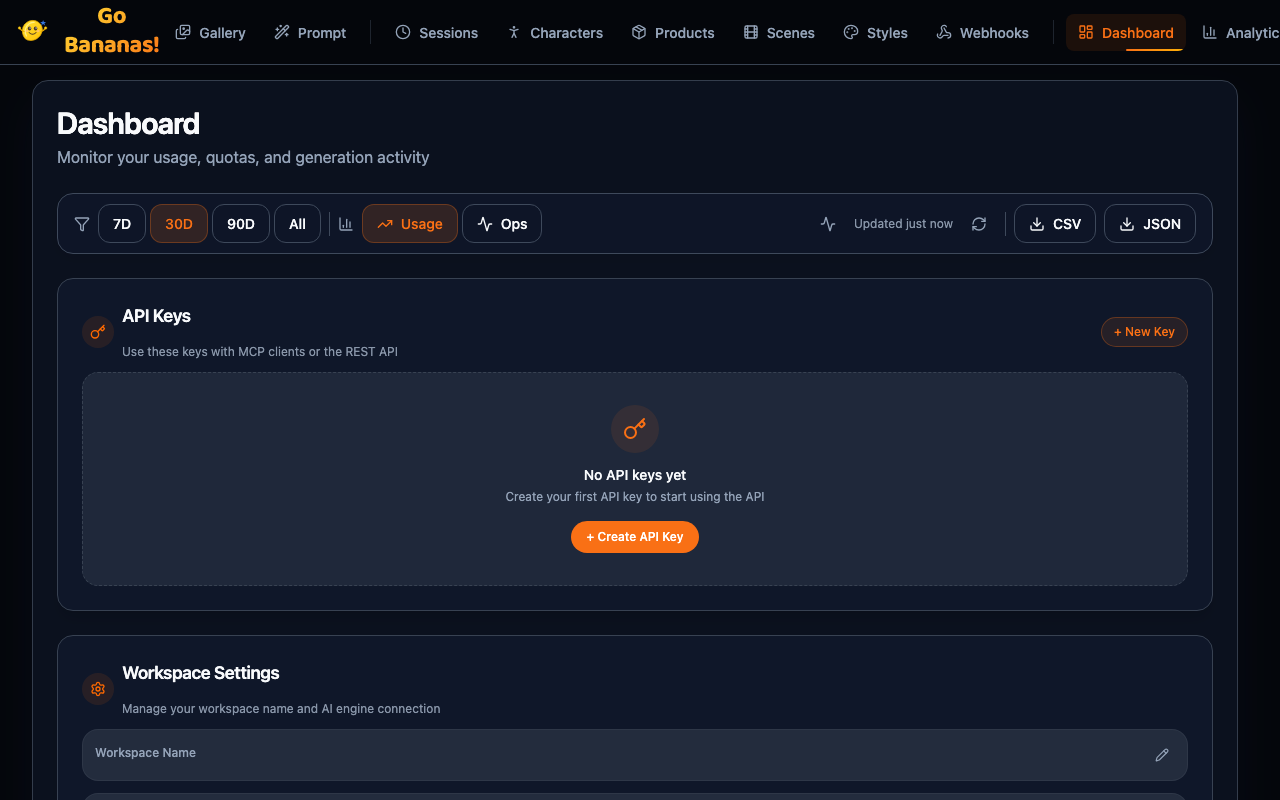
Overview
The dashboard displays:
- Quota status with visual progress bars
- Usage statistics over time
- Quick stats cards with key metrics
- Activity charts for trend analysis
Quota Tracking
Storage Quota
The primary quota indicator shows storage usage:
┌──────────────────────────────────────────┐
│  Monthly Quota                           │
│  ████████████████░░░░░░  856 MB / 1 GB   │
│                         85.6% used       │
└──────────────────────────────────────────┘Status Colors:
- 🟢 Green (0-70%): Normal
- 🟡 Yellow (70-90%): Warning
- 🔴 Red (90-100%): Critical
Rate Limit Status
Shows your API rate limit consumption:
┌──────────────────────────────────────────┐
│  Rate Limit (resets in 45s)              │
│  ██████░░░░░░░░░░░░░░░░  12 / 60 req/min │
└──────────────────────────────────────────┘Stat Cards
Quick metrics at the top of the dashboard:
| Card | Shows |
|---|---|
| Images This Month | Total generations this billing period |
| Storage Used | Current storage consumption |
| Active Sessions | Currently active conversations |
| Total Characters | Characters in your library |
| Style Presets | Saved style templates |
| Avg Generation | Average generation time (ms) |
Card Details
Click any stat card to see detailed breakdown:
┌─────────────────┐
│ 📊 Images: 342  │ ← Click
│   This Month    │
└────────┬────────┘
         ▼
┌─────────────────────────────┐
│ Breakdown:                  │
│ • Generations: 280          │
│ • Edits: 62                 │
│ • Characters: 45            │
│ • Products: 17              │
│                             │
│ Daily Avg: 11.4 images      │
│ Peak Day: Jan 15 (28)       │
└─────────────────────────────┘Usage Charts
Time Series Chart
Shows usage over time with configurable range:
Images Generated
    ▲
 40 │    ╭─╮
    │ ╭──╯ ╰╮   ╭──╮
 20 │╯      ╰───╯  ╰─╮
    │                 ╰──
  0 └────────────────────► Days
M T W T F S SControls:
- Date range: 7d, 30d, 90d, All time
- Granularity: Hour, Day, Week
- Metric: Images, Storage, Operations
Operation Breakdown
Pie chart showing operation distribution:
    ╭────────────╮
   ╱  Generate   ╲
  │    (73%)      │
  │  ╭────────╮   │
  │  │ Edit   │   │
   ╲ │ (21%)  │  ╱
    ╰│ Other │─╯
(6%)Bar Chart
Monthly or weekly comparison:
    ▄
    █
    █   ▄
    █   █   ▄
 ▄  █   █   █   ▄
 █  █   █   █   █
─┴──┴───┴───┴───┴─
Jan Feb Mar Apr MayDate Range Selector
Filter all dashboard data by date range:
| Range | Description |
|---|---|
| Last 7 days | Recent week |
| Last 30 days | Current month |
| Last 90 days | Quarter view |
| All time | Complete history |
| Custom | Pick specific dates |
Auto-Refresh
The dashboard can auto-refresh:
┌────────────────────────────────────┐
│  ⟳ Auto-refresh: Every 60s [On ▼] │
│     Next update in: 45s            │
└────────────────────────────────────┘Enable for real-time monitoring during active work sessions.
Export Options
Export dashboard data:
| Format | Use Case |
|---|---|
| CSV | Spreadsheet analysis |
| JSON | Programmatic processing |
| Reports and sharing |
Click Export in the header to download data.
Dashboard Widgets
Recent Activity
┌─────────────────────────────────────┐
│ Recent Activity                     │
├─────────────────────────────────────┤
│ 🖼️ Generated "sunset beach" - 2m   │
│ ✏️ Edited image #342 - 5m           │
│ 👤 Created character "Luna" - 1h   │
│ 🖼️ Generated with Luna - 1h        │
│ 📦 Added product reference - 2h    │
└─────────────────────────────────────┘Top Items
┌─────────────────────────────────────┐
│ Most Used This Month                │
├─────────────────────────────────────┤
│ Characters:                         │
│   1. Luna (45 uses)                 │
│   2. Captain Rex (23 uses)          │
│   3. Felix (18 uses)                │
│                                     │
│ Style Presets:                      │
│   1. Cinematic (89 uses)            │
│   2. Anime (56 uses)                │
│   3. Vintage Film (34 uses)         │
└─────────────────────────────────────┘Alerts & Warnings
The dashboard displays alerts for:
- ⚠️ Quota approaching limit (>80%)
- 🔴 Quota exceeded
- ⚠️ Rate limit warnings
- ℹ️ System announcements
┌─────────────────────────────────────┐
│ ⚠️ Storage at 85% - Consider        │
│    cleaning up unused images        │
│                          [Dismiss]  │
└─────────────────────────────────────┘Quick Actions
Dashboard quick actions:
| Button | Action |
|---|---|
| + Generate | Jump to Composer |
| View Gallery | Browse all images |
| Manage Library | Characters/Products |
| Export Report | Download analytics |
Responsive Layout
The dashboard adapts to screen size:
Desktop: Full grid layout with all widgets Tablet: Stacked cards, scrollable charts Mobile: Single column, essential metrics first
Customization
Administrators can configure:
- Default date range
- Visible widgets
- Alert thresholds
- Refresh intervals
API Data Source
Dashboard data comes from:
GET /api/profile          → Quota information
GET /api/usage?limit=30   → Usage statistics
GET /api/sessions         → Session counts
GET /api/characters       → Character library