
Workflow Diagrams & Infographics Master Guide
Transform Mermaid syntax or natural language into professional visual diagrams using Go Bananas Pro model.
Quick Reference: See Workflow Diagrams Feature for a condensed overview.
Table of Contents
- Part 1: Introduction
- Part 2: Quick Start
- Part 3: Mermaid Syntax Conversion
- Part 4: Output Format Selection
- Part 5: Style Templates
- Part 6: Pro Model Settings
- Part 7: Golden Rules
- Part 8: Advanced Techniques
- Part 9: Troubleshooting
- Appendix A: Complete Mermaid Reference
- Appendix B: Style Color Palettes
- Appendix C: Prompt Templates
Part 1: Introduction
What Are Workflow Diagrams?
The Workflow Diagrams skill transforms structured input (Mermaid syntax or natural language) into beautiful, professional visual diagrams. Instead of rendering basic SVGs, Go Bananas Pro creates production-quality visuals suitable for presentations, documentation, and marketing.
Why Use This Skill?
| Challenge | Solution |
|---|---|
| Mermaid renders as basic SVGs | Pro model creates polished, styled visuals |
| Design tools require expertise | Natural language descriptions work |
| Inconsistent styling across diagrams | Pre-defined style templates |
| No real-time data in diagrams | Google Search grounding for live stats |
| Manual diagram creation is slow | Generate in seconds from text |
What You Can Create
- Flowcharts - Process flows with decision points
- Infographics - Data visualizations, statistics displays
- Timelines - Project roadmaps, historical events
- Org Charts - Team hierarchies, company structures
- Mind Maps - Idea brainstorming, concept organization
- Sequence Diagrams - API flows, system interactions
- And More - All 13 Mermaid diagram types supported
Part 2: Quick Start
Method 1: From Mermaid Syntax
The fastest way to create visuals if you have Mermaid syntax:
Convert this Mermaid diagram to a professional flowchart:

graph TD
    A[User Request] --> B{Valid Input?}
    B -->|Yes| C[Process Data]
    B -->|No| D[Show Error]
    C --> E[Return Result]
    D --> E

Style: Corporate blue theme with drop shadowsMethod 2: From Natural Language
No Mermaid knowledge required:
Create a flowchart showing the customer onboarding process:
1. User signs up with email
2. System sends verification email
3. Decision: Did user verify?
   - Yes: Create user profile → Show welcome dashboard
   - No: Wait 24 hours → Resend email or expire

Corporate style with numbered steps.Method 3: Data Infographic (with Real-Time Data)
For infographics with current data:
Create an infographic comparing the top 5 cloud providers
by market share in 2024. Fetch current data.

Layout: Horizontal bar chart with company logos
Style: Modern dark theme with gradient barsEnable enable_grounding: true for real-time data
Method 4: Timeline
Create a timeline showing our product roadmap:

Q1 2024: Research & Planning
Q2 2024: MVP Development
Q3 2024: Beta Testing
Q4 2024: Public Launch
Q1 2025: Enterprise Features

Horizontal layout with milestone markers.
Corporate blue with progress indicators.Part 3: Mermaid Syntax Conversion
Supported Diagram Types
The skill supports all 13 Mermaid diagram types:
| Type | Syntax | Best For |
|---|---|---|
| Flow Diagram | graph TD/LR/BT/RL | Processes, decisions |
| Flowchart | flowchart TD | Same as graph |
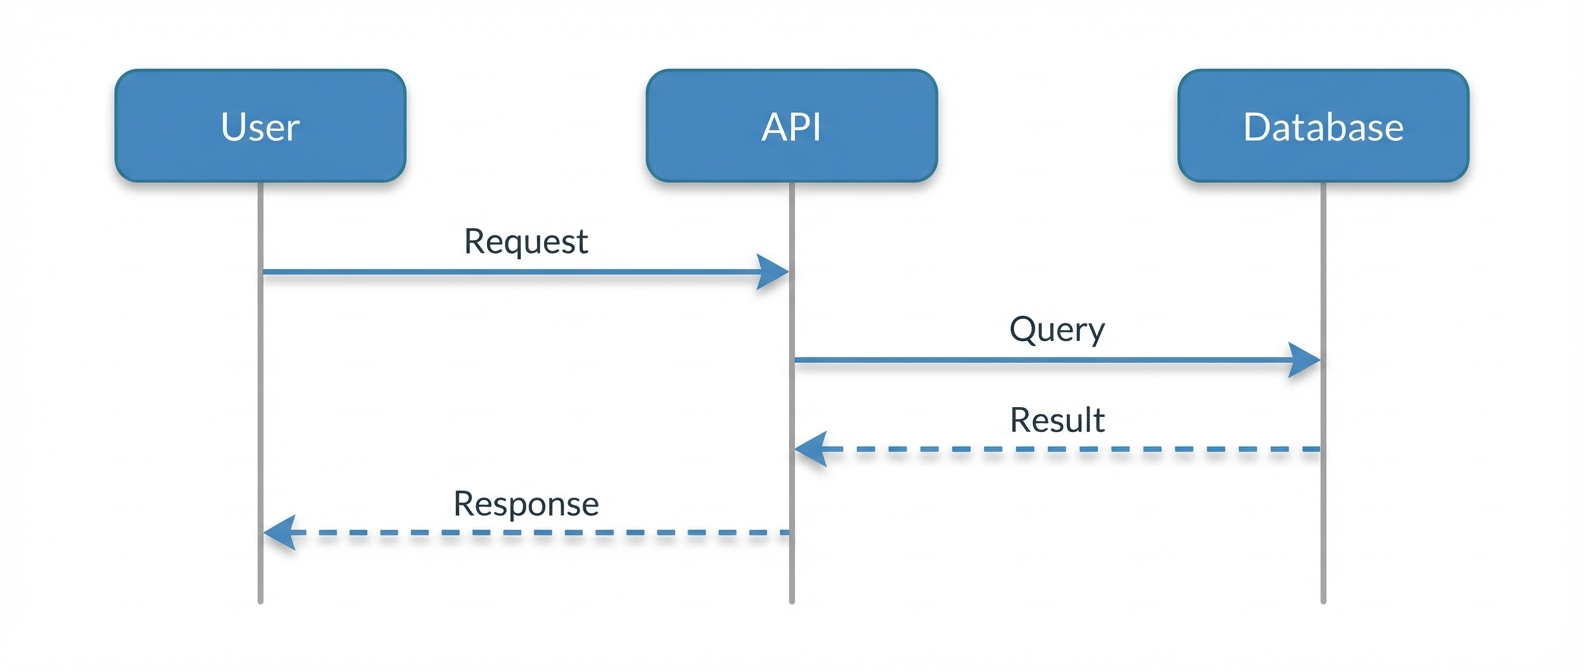
| Sequence | sequenceDiagram | API flows, interactions |
| Class Diagram | classDiagram | Entity relationships |
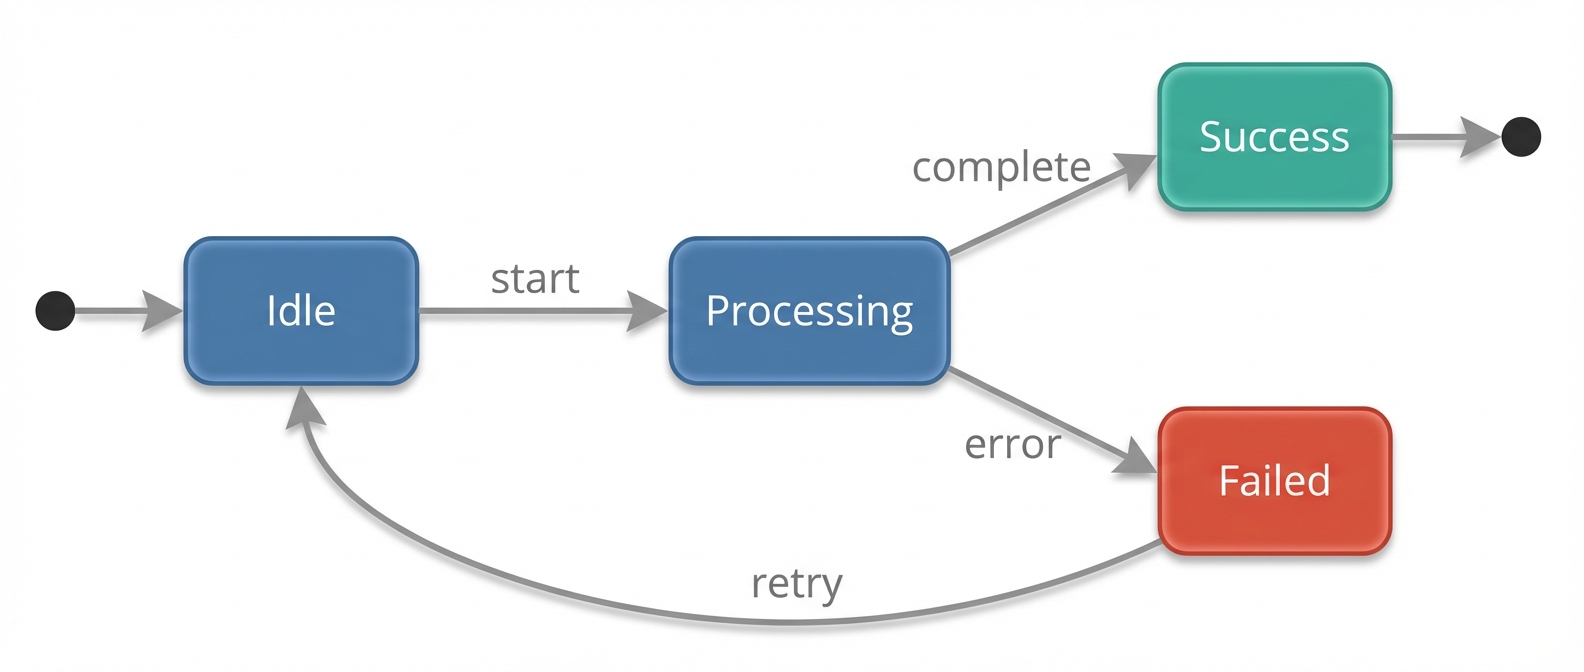
| State Diagram | stateDiagram-v2 | State machines |
| ER Diagram | erDiagram | Database schemas |
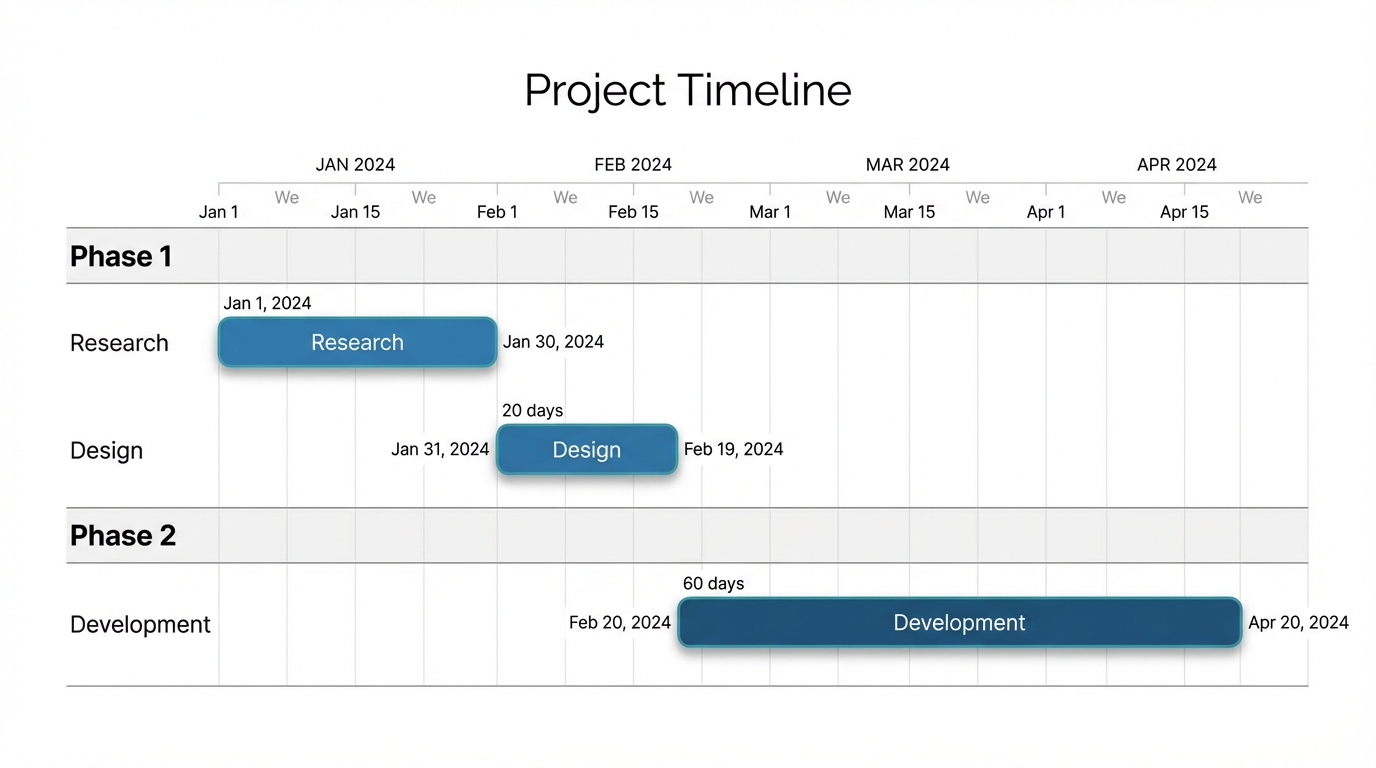
| Gantt Chart | gantt | Project timelines |
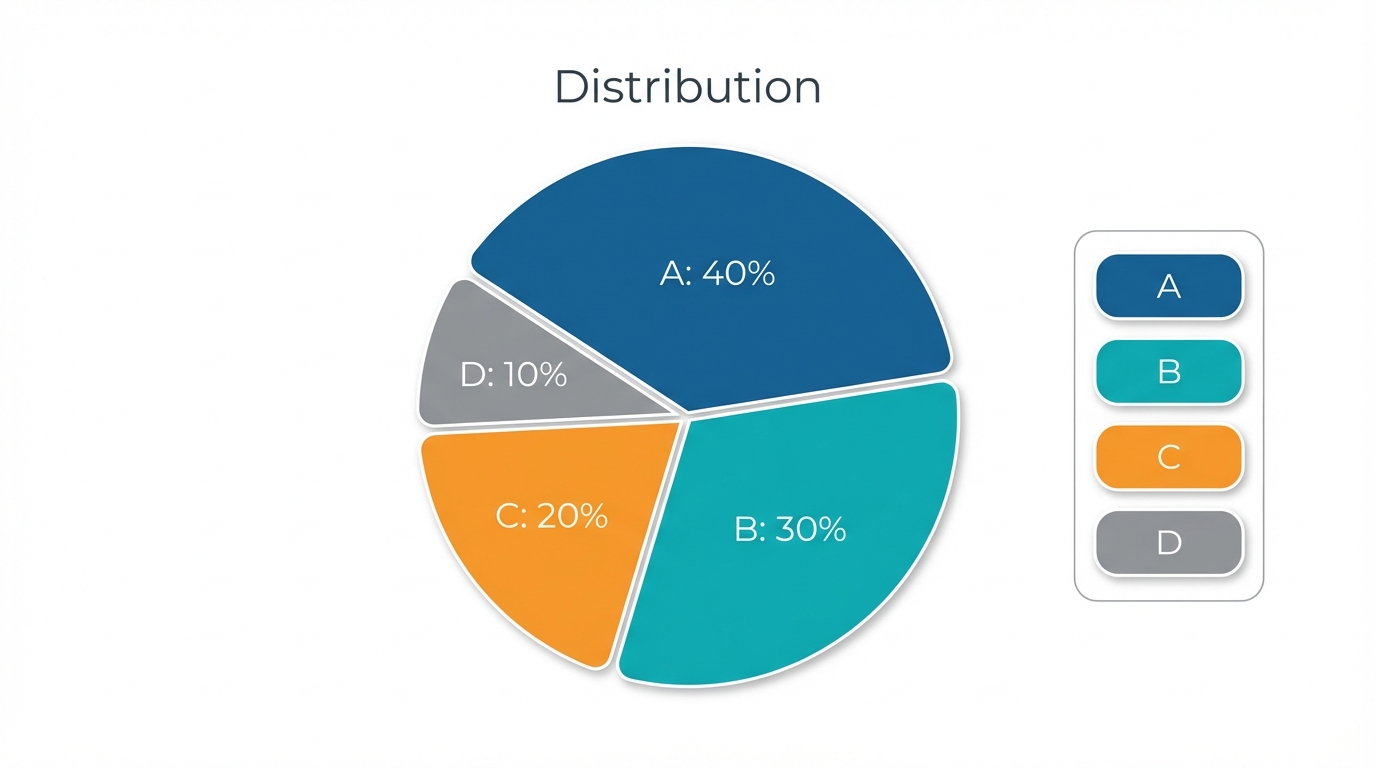
| Pie Chart | pie | Data distribution |
| User Journey | journey | UX flows |
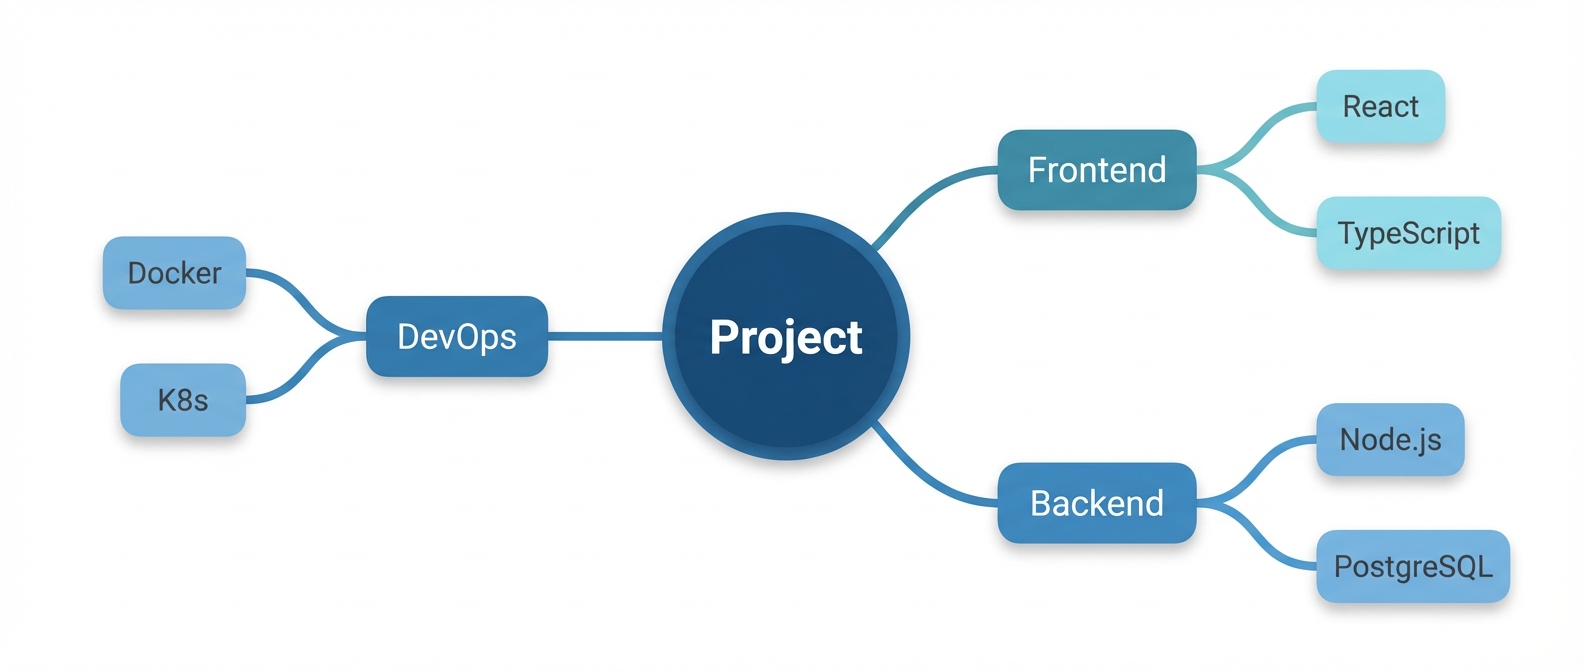
| Mind Map | mindmap | Idea organization |
| Timeline | timeline | Chronological events |
| Quadrant | quadrantChart | Priority matrices |
| Git Graph | gitgraph | Branch visualizations |
Direction Keywords
| Mermaid | Visual Description |
|---|---|
TD / TB | Top-to-bottom flow |
BT | Bottom-to-top flow |
LR | Left-to-right horizontal |
RL | Right-to-left horizontal |
Node Shapes
| Mermaid | Shape | Visual |
|---|---|---|
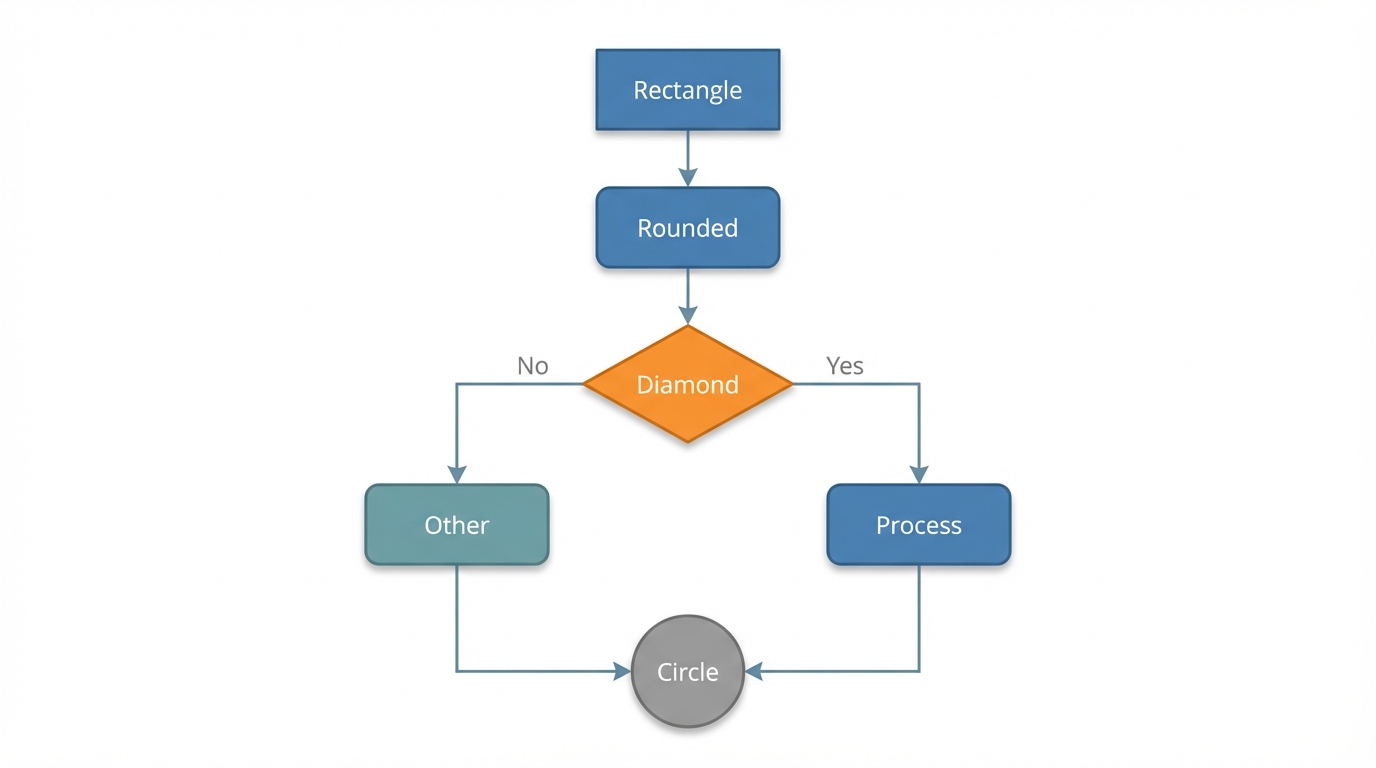
A[Text] | Rectangle | Standard process step |
A(Text) | Rounded | Softer process step |
A{Text} | Diamond | Decision point |
A((Text)) | Circle | Start/end terminal |
A[(Text)] | Cylinder | Database |
A | Hexagon | Preparation step |
Arrow Types
| Mermaid | Description |
|---|---|
--> | Solid arrow |
--- | Line without arrow |
-.-> | Dashed arrow |
==> | Thick/bold arrow |
--text--> | Labeled arrow |
Conversion Example
Input (Mermaid):
Generated Visual: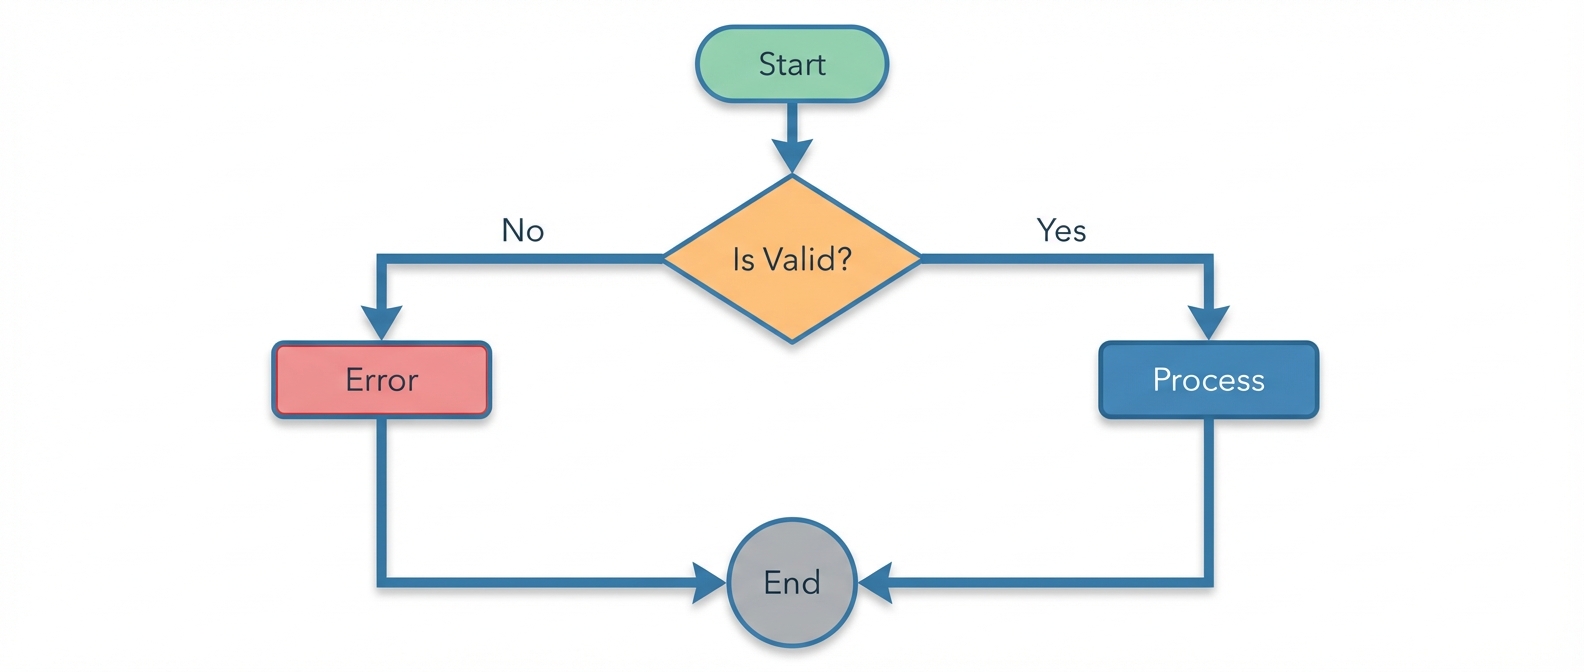
Converted to Visual Prompt:
Create a professional flowchart with top-to-bottom flow:

NODES:
- Green rectangle "Start" at top
- Orange diamond "Is Valid?" decision
- Blue rectangle "Process" (right path)
- Red rectangle "Error" (left path)
- Gray circle "End" at bottom

CONNECTIONS:
- Arrow from Start to decision
- "Yes" labeled arrow to Process
- "No" labeled arrow to Error
- Both paths converge to End

STYLE: Corporate, subtle shadows, professional sans-serif.Part 4: Output Format Selection
Auto-Selection Logic
The skill automatically chooses the best output format:
| Input Characteristics | Selected Format |
|---|---|
| Decision points, yes/no branches | Flowchart |
| Statistics, percentages, comparisons | Infographic |
| Dates, phases, chronological | Timeline |
| Hierarchy, reporting structure | Org Chart |
| Ideas branching from center | Mind Map |
| Actors sending messages | Sequence Diagram |
| Data distribution | Pie/Bar Chart |
Manual Override
You can specify the format:
Create this as a **swimlane diagram**:
[your content]

Create this as a **vertical timeline**:
[your content]Format Descriptions
Flowchart
Best for: Process flows, decision trees, algorithms
Rectangular steps, diamond decisions, arrows connecting.
Typically top-to-bottom or left-to-right.Infographic
Best for: Statistics, comparisons, KPIs
Large numbers, icons, progress bars, comparison charts.
Visual hierarchy with hero metrics prominent.Timeline
Best for: Roadmaps, project phases, history
Linear progression (horizontal or vertical).
Milestone markers, date labels, phase descriptions.Org Chart
Best for: Team structure, hierarchies
Tree layout with boxes connected by lines.
Top-down or left-to-right hierarchy.Mind Map
Best for: Brainstorming, concept mapping
Central node with branches radiating outward.
Sub-branches for nested ideas.Part 5: Style Templates
Available Styles
Choose a pre-defined style to ensure professional results:
Corporate
- Clean blue primary (#0066CC)
- White backgrounds with gray borders
- Rounded corners, subtle shadows
- Professional sans-serif typographyMinimal
- Black and white with blue accent
- Maximum whitespace
- Thin borders (1px)
- Sharp corners, no shadowsHand-drawn
- Slightly wobbly lines
- Off-white paper background
- Marker-like colored fills
- Handwriting-style fontBlueprint
- White lines on dark blue (#0D3B66)
- Engineering grid background
- Technical monospace font
- Dimension-style annotationsRetro
- Vintage colors (orange, teal, mustard)
- Cream paper background
- Thick black outlines
- 1950s infographic aestheticModern
- Bold vibrant colors (indigo, purple, pink)
- Heavily rounded corners
- Soft shadows with blur
- Flat design with occasional gradientsDark Mode
- Dark slate background (#0F172A)
- Light text on dark surfaces
- Bright accent colors that pop
- No harsh whitesNeon
- Near-black background
- Bright neon colors (cyan, magenta, green)
- Glowing edges on shapes
- Futuristic/cyberpunk aestheticGradient
- Smooth gradient fills
- Consistent gradient direction
- White text on gradient backgrounds
- Premium, modern feelUsing Styles
Simply add the style name to your prompt:
Create a flowchart showing user authentication.
Use **corporate style** with company blue.Create a mind map of project ideas.
Use **hand-drawn style** for whiteboard aesthetic.Part 6: Pro Model Settings
Recommended Configuration
For best results with diagrams:
{
  model_id: "gemini-pro-image",     // Required for diagrams
  resolution_tier: "2k",             // 4k for print
  thinking_level: "high",            // Better layout reasoning
  enable_grounding: true,            // For real-time data
  aspect_ratio: "16:9"               // Good for presentations
}When to Use Each Setting
| Setting | When to Use |
|---|---|
resolution_tier: "1k" | Quick drafts, web use |
resolution_tier: "2k" | Presentations, documentation |
resolution_tier: "4k" | Print materials, large displays |
thinking_level: "low" | Simple diagrams |
thinking_level: "high" | Complex layouts, many elements |
enable_grounding: true | Infographics with real data |
Pro vs Flash
| Feature | Flash | Pro |
|---|---|---|
| Text rendering | Basic | Advanced |
| Layout reasoning | Limited | Full |
| Resolution options | 1K | 1K, 2K, 4K |
| Search grounding | No | Yes |
| Best for diagrams | Simple | Complex |
Recommendation: Always use Pro for workflow diagrams.
Part 7: Golden Rules
1. Be Descriptive and Specific
Write full sentences describing the complete visual.
Bad:
flowchart, blue, arrows, processGood:
A corporate flowchart with rounded blue rectangles for process
steps, orange diamonds for decision points, and green circles
for start/end nodes. Use thin gray arrows with subtle shadows.2. Explicitly Define Layout
Tell the model exactly where elements go:
- Start node at the top center
- Three columns below: left for errors, center for success, right for pending
- All paths converge to End node at bottom3. Use Quoted Text for Labels
Ensure exact text appears on nodes:
- The start node contains the text "User Request"
- Decision diamond labeled "Is Valid?"
- End node displays "Complete"4. Specify Visual Style
Be explicit about the aesthetic:
- Rendered as if drawn on a whiteboard
- Professional corporate presentation style
- Modern flat design with soft drop shadows5. Leverage Real-Time Data
For infographics with current data:
Create an infographic of top 5 programming languages
by TIOBE index in 2024. Use current rankings.6. Iterate with Edits
If 80% correct, use continue_editing:
Make the decision diamonds orange instead of yellow
Add a legend in the bottom right corner
Increase spacing between nodesPart 8: Advanced Techniques
Swimlane Diagrams
Create a swimlane diagram for purchase order approval:

LANES (top to bottom):
- Requester (blue header)
- Manager (green header)
- Finance (orange header)
- Vendor (purple header)

FLOW:
Requester submits PO → Manager reviews →
Finance checks budget → Vendor processes order

Show activities crossing lanes with clear handoffs.Multi-Section Infographics
Create a statistics dashboard infographic:

SECTION 1 (hero metric):
- "2.5M" Active Users
- "+150% YoY" growth indicator

SECTION 2 (supporting metrics, 3-column):
- "99.9% Uptime"
- "45ms Response Time"
- "180 Countries"

SECTION 3 (trend chart):
- 12-month user growth line chart

Modern dark theme, cyan accents.Decision Trees
Create a decision tree for customer support routing:

Level 0: "Customer contacts support"
Level 1: "Billing issue?" (Yes/No)
  - Yes → "Billing Team"
  - No → Level 2
Level 2: "Technical issue?" (Yes/No)
  - Yes → Level 3: "Priority?" (High/Low)
    - High → "Senior Engineer"
    - Low → "Support Queue"
  - No → "FAQ Bot"

Color-code by department. Include legends.Combining Data Sources
Create a comparison infographic:

Fetch current data for:
- AWS market share
- Azure market share
- GCP market share

Display as:
- Horizontal bar chart with company logos
- Percentage labels on bars
- Year-over-year change indicators

Source citation at bottom.Part 9: Troubleshooting
Common Issues
Text Not Appearing Correctly
Problem: Labels are missing or garbled
Solutions:
- Use quoted text:
labeled "Exact Text" - Keep labels short (under 20 characters)
- Use Pro model (better text rendering)
Layout Problems
Problem: Elements overlap or misaligned
Solutions:
- Specify explicit positions
- Use
thinking_level: "high" - Reduce number of elements
- Break into multiple diagrams
Style Not Applied
Problem: Diagram looks generic
Solutions:
- Be more specific about colors
- Include hex codes:
blue (#0066CC) - Describe textures and effects
Real-Time Data Missing
Problem: Grounding not working
Solutions:
- Ensure
enable_grounding: true - Use Pro model
- Be specific about what data to fetch
Decision Tree: Choosing the Right Approach
Is your input Mermaid syntax?
├── Yes → Convert to visual prompt (Part 3)
└── No → Describe in natural language

Do you need real-time data?
├── Yes → Enable grounding, use Pro model
└── No → Either model works

Is the diagram complex (>10 elements)?
├── Yes → Use thinking_level: "high", 2K+ resolution
└── No → Default settings work

Do you need print quality?
├── Yes → Use 4K resolution
└── No → 1K or 2K is fineAppendix A: Complete Mermaid Reference
Flow/Flowchart
Sequence Diagram
Gantt Chart
Pie Chart
Mind Map
State Diagram
Appendix B: Style Color Palettes
Corporate
| Role | Hex | Usage |
|---|---|---|
| Primary | #0066CC | Main elements |
| Secondary | #004499 | Accents |
| Success | #28A745 | Positive |
| Warning | #FFC107 | Caution |
| Error | #DC3545 | Negative |
| Neutral | #6C757D | Borders |
Modern
| Role | Hex | Usage |
|---|---|---|
| Primary | #6366F1 | Indigo |
| Secondary | #8B5CF6 | Purple |
| Accent | #EC4899 | Pink |
| Success | #10B981 | Emerald |
| Warning | #F59E0B | Amber |
Dark Mode
| Role | Hex | Usage |
|---|---|---|
| Background | #0F172A | Main |
| Surface | #1E293B | Cards |
| Border | #334155 | Dividers |
| Text | #F1F5F9 | Primary |
| Accent | #3B82F6 | Highlights |
Retro
| Role | Hex | Usage |
|---|---|---|
| Primary | #D64933 | Orange-red |
| Secondary | #E8B04B | Mustard |
| Tertiary | #2D5F5D | Teal |
| Paper | #F5E6D3 | Background |
Appendix C: Prompt Templates
Basic Flowchart
Create a flowchart showing [PROCESS NAME]:

Start: [INITIAL STATE]
Step 1: [ACTION]
Decision: [QUESTION]?
  - Yes: [PATH A]
  - No: [PATH B]
End: [FINAL STATE]

Style: [STYLE NAME], [COLORS]Statistics Infographic
Create a statistics infographic:

HERO METRIC:
- "[NUMBER]" [LABEL]
- "[CHANGE]" trend indicator

SUPPORTING (3 items):
- "[STAT 1]" [LABEL]
- "[STAT 2]" [LABEL]
- "[STAT 3]" [LABEL]

Style: [STYLE], [BACKGROUND COLOR]Project Timeline
Create a timeline for [PROJECT NAME]:

[DATE/PHASE 1]: [MILESTONE 1]
[DATE/PHASE 2]: [MILESTONE 2]
[DATE/PHASE 3]: [MILESTONE 3]
[DATE/PHASE 4]: [MILESTONE 4]

Layout: [Horizontal/Vertical]
Style: [STYLE NAME]
Mark current position at: [PHASE]Comparison Chart
Create a comparison infographic:

ITEMS TO COMPARE:
- [ITEM A]: [VALUE A]
- [ITEM B]: [VALUE B]
- [ITEM C]: [VALUE C]

DISPLAY AS: [Bar chart / Table / Side-by-side]
Include: [Logos / Icons / Trend arrows]
Style: [STYLE NAME]Decision Tree
Create a decision tree:

ROOT: [STARTING QUESTION]
├── [OPTION 1] → [RESULT 1]
├── [OPTION 2] → [SUB-QUESTION]
│   ├── [SUB-OPTION A] → [RESULT 2A]
│   └── [SUB-OPTION B] → [RESULT 2B]
└── [OPTION 3] → [RESULT 3]

Style: [STYLE], color-coded by [CATEGORY]Summary
The Workflow Diagrams skill transforms Mermaid syntax or natural language into professional visual diagrams. Key points:
- 13 Mermaid Types Supported - Flow, sequence, gantt, mind map, and more
- Auto Format Selection - Skill chooses flowchart, infographic, timeline, etc.
- 9 Visual Styles - Corporate, Minimal, Hand-drawn, Blueprint, Retro, Modern, Dark, Neon, Gradient
- Real-Time Data - Google Search grounding for live statistics
- Pro Model Recommended - Best text rendering and layout reasoning
For quick reference, see the Workflow Diagrams Feature Page.